traffic_analyzer/Getty Images


Election years and the TSP
COMMENTARY | Investing during election years is an exercise in not letting your emotions drive your decisions, says one financial advisor.
Election years can be many things. Optimistically, they’re an exciting opportunity to participate in our country’s democratic process and select new leaders. On the other end of the spectrum, they can be a time of heightened divisiveness and fear.
For the 24-hour news cycle, election years are like the Olympics – an opportunity to keep our eyeballs glued to our TVs, phones, and computers, processing each candidate’s latest victory or defeat.
And what’s one of the media’s favorite tactics to keep us engaged? Fear. If they can keep us worried about the future, we have to keep tuning in to find out when things will get better.
At this point you may be thinking “Hey, I thought this was an investment article…” It is, but we need to acknowledge WHY election years are different from any other year in the stock market. Although we’d love to think of the stock market as a purely logical system based strictly on the returns of the underlying companies, the truth is that emotions play a huge role in both the overall market, and the success of your individual portfolio.
So, before you go and make changes to your TSP in anticipation of what may come, take a step back, consider the data and remember this: Investing during election years is an exercise in not letting your emotions drive your decisions.
Election Year Stock Market Facts
Here’s what history tells us about what happens in election years:
- U.S. Stocks (C Fund & S Fund) have trended up regardless of whether a Republican or Democrat won the election.
- Primary season tends to be volatile, but markets have bounced back strongly afterward.
- Investors tend to get nervous and move to cash (or G Fund) during election years.
- Staying on the sidelines during election years has rarely paid off.
Let’s start with that first bullet point. Would it surprise you to know that markets have actually done BETTER in election years than in non-election years?
Since 1860, a 60/40 (stock/bond or C Fund/F Fund) portfolio has had an average annual return of:
- Presidential election years: 8.7%
- Non-presidential election years: 7.7%
There’s another misconception that one party is “better” for the market than another. In reality, returns under Democratic and Republican presidents have been almost identical:
- Annual compound return under a Democratic president: 8.4%
- Annual compound return under a Republican president: 8.2%
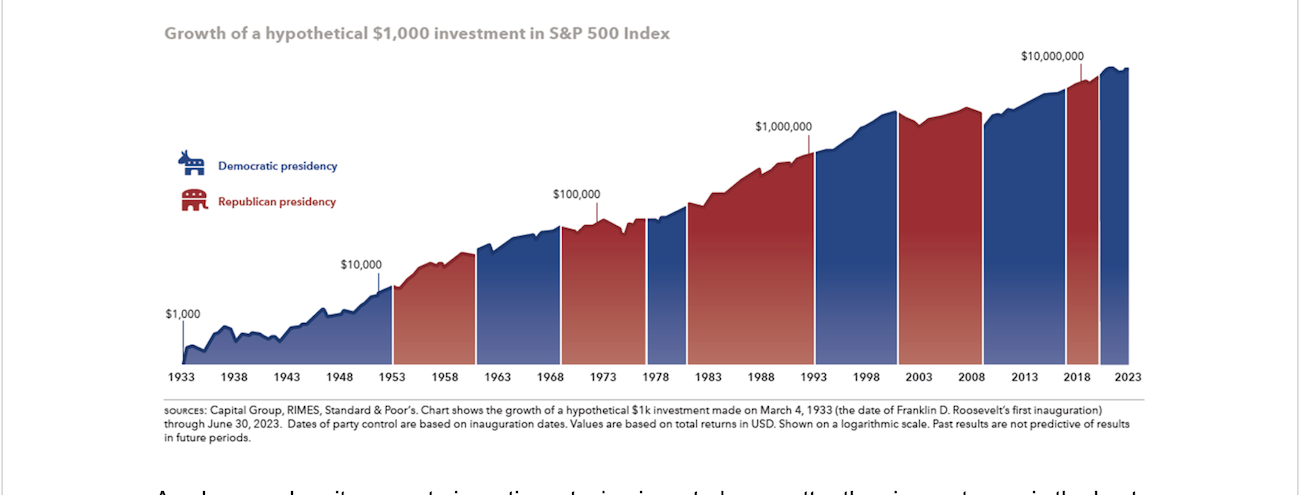
As always, when it comes to investing, staying invested, no matter the circumstance, is the best way to make money over time.
Hypothetical Investor Study
In case you need additional data to back that up, Capital Group ran a study that looked at three hypothetical investors over the 22 election cycles since 1932.
Investor 1: Invested $10,000 on Jan. 1 of the election year, and kept it invested through the 4-year presidency.
Investor 2: Was uncomfortable investing all $10,000 up front, but instead decided to invest $1,000/month for the first 10 months of the election year, and then held that investment until the end of the 4-year presidency.
Investor 3: Was the most nervous about the election. They held their $10,000 investment out of the market during the election year and invested it all on Jan 1st of the following year. They also held it until the end of the 4-year presidency.
Here are the results:
Investor 1: On average, their $10,000 turned into $15,865, the highest of the three investors. They had the best outcome in 14 of the 22 cycles.
Investor 2: On average, their $10,000 turned into $15,738, only slightly behind the first investor, and the second highest return. They had the best outcome in five of the 22 cycles.
Investor 3: On average, their $10,000 turned into $14,936. Still a positive return, but the lowest of the three. Investor three only had the best outcome in three of the 22 cycles.
Psychology of Investing
Now you have the data, but will that be enough?
As much as we’d like to believe that we’re perfectly rational in our decision making, psychology experts would beg to differ. Humans succumb to many psychological “biases” that impact our behavior and drive our decisions.
One example is “Herding Bias,” or the tendency to follow the crowd instead of thinking independently.
When everyone around you is talking about how “if this candidate wins, it will be the end of the world”, it can be difficult to keep a level head. Especially when it comes to your life savings.
Even professional athletes fall victim to thinking that they can “outsmart” the statistics.
Statistics show that the best strategy for a goalkeeper during a penalty kick is to stay in the middle of the goal. But goalkeepers jump left or right 94% of the time.
As financial planners, we see federal employees try to “outsmart” the market all the time, by switching to the G Fund when they think things will get volatile, and then waiting to get back into stocks when the coast looks clear.
I’ll let you in on a secret. The coast almost never looks “clear,” and as demonstrated in the study above, people who do that typically wind up falling behind.
Listening to historical data can be hard, but in reality, investing in the market requires facing a continuous cycle of unknowns. The fear and uncertainty we face is just the “price of admission.” Election years are no different.
So, how should you invest your TSP this year? As long as you’ve thoughtfully considered your investment strategy and risk tolerance, you probably shouldn’t change a thing. Just strap in and enjoy the ride.
Austin Costello is a certified financial planner with Capital Financial Planners. If you don’t feel confident in your investment strategy or your ability to keep a level head and would like feedback, register for a complimentary check up. For topics covered in even greater depth, see our recorded webinars.