


Why the White House’s Environmental Justice Tool Is Still Disappointing Advocates
New changes “ended up making the program less focused on people of color than it originally was,” one advocate said.
This story was originally published by Grist. You can subscribe to its weekly newsletter here.
After assuming office in early 2021, President Joe Biden announced the Justice40 initiative, which promised that 40 percent of federal investments in infrastructure, clean energy, and other climate-related programs would be directed toward disadvantaged communities. The program is an effort to counteract the legacy of past policies that have unevenly distributed the country’s environmental burdens, with communities of color historically faring the worst in terms of underinvestment and pollution exposure.
In order to implement Biden’s vision for equitable federal spending, the government first needed to decide which communities would officially be considered “disadvantaged.” The Climate and Economic Justice Screening Tool, or CEJST, that debuted last year is an attempt to use reams of socioeconomic and environmental data to pinpoint neighborhoods facing the greatest burdens.
But the beta version of the tool, which was developed by the White House Council on Environmental Quality in an open-source process, quickly proved controversial. Despite evidence that race is the strongest and most consistent predictor of environmental burdens, the tool did not explicitly consider racial demographics as a factor that could tip a community into the “disadvantaged” category. While the White House said it made the decision to avoid legal challenges, environmental justice advocates were incensed, fearing that without considering race the tool would fail to identify disadvantaged communities of color that should be prioritized for Justice40 funds.
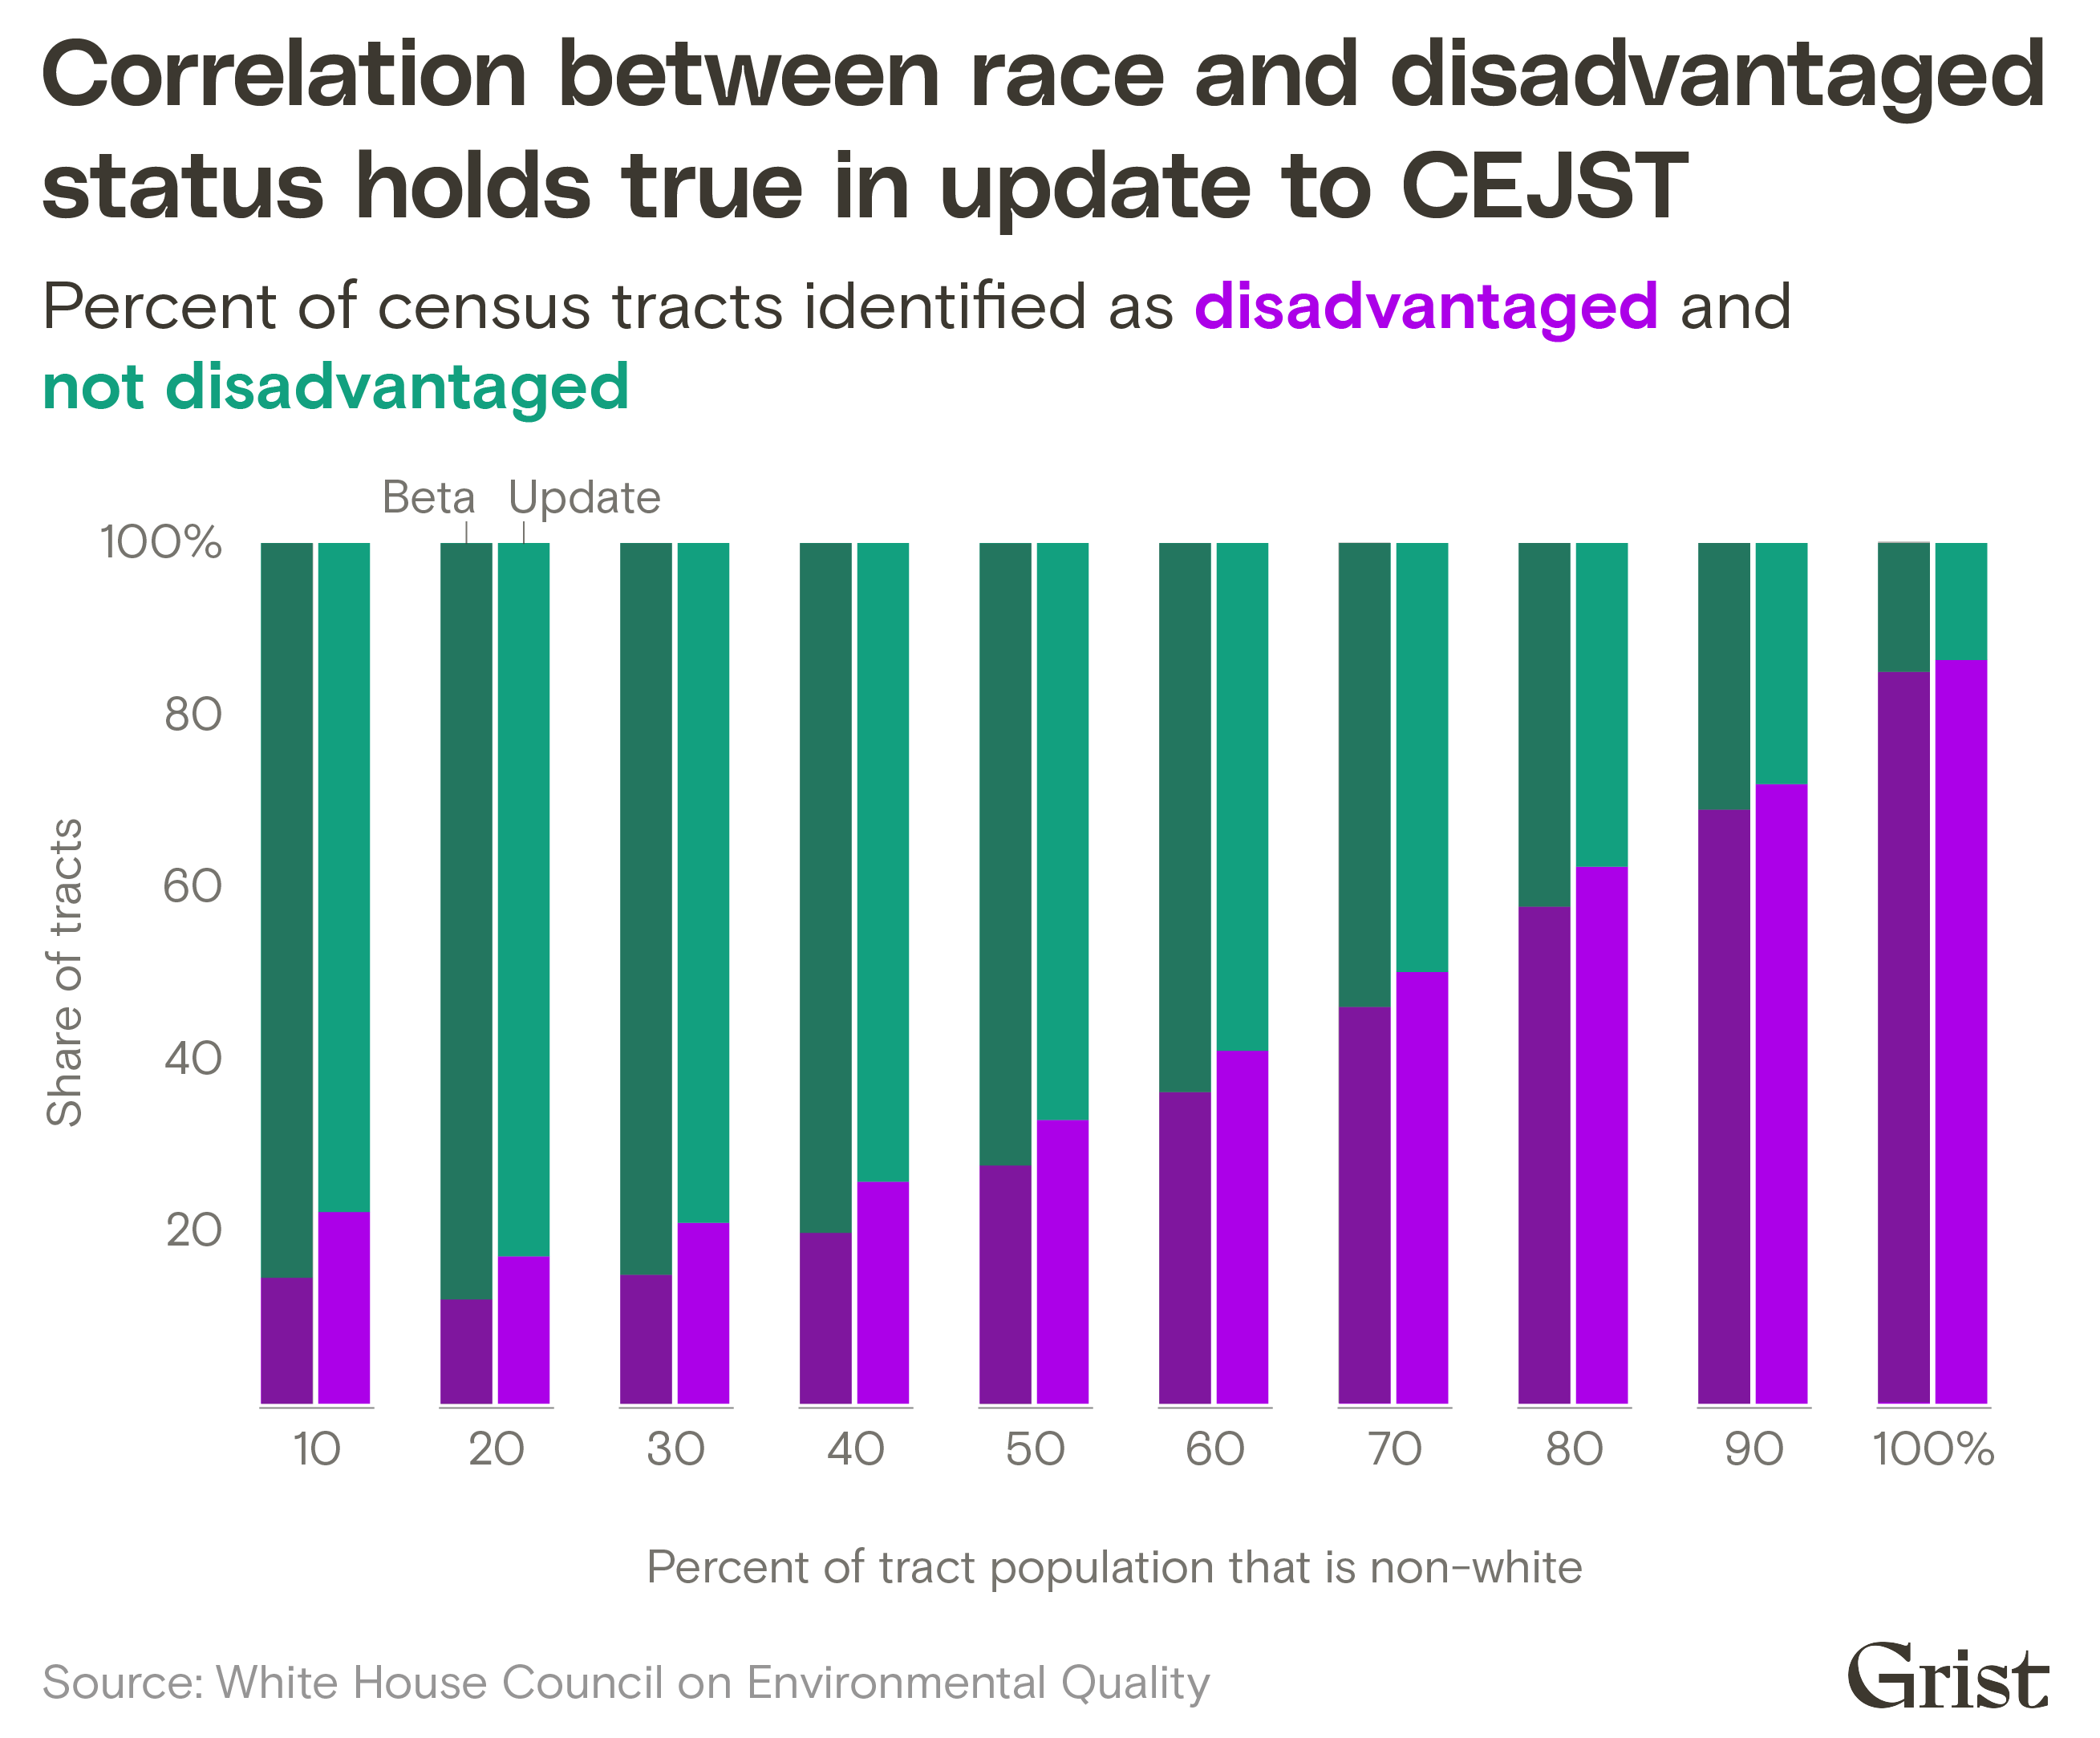
A Grist analysis last year found that many of these fears didn’t come to pass. By analyzing criteria such as proximity to traffic, linguistic isolation, and proximity to hazardous waste sites — factors which are all strongly correlated with race — the tool was able to account for race by proxy. As a result, the race-neutral screening tool still prioritized communities of color. The higher a census tract’s non-white population, the more likely that it would be flagged as disadvantaged.
Still, roughly 9,000 census tracts where the majority of residents are non-white were not considered disadvantaged by the tool. While some of these, like parts of the California Bay Area, are high-income areas with little pollution exposure, others, like parts of San Bernardino County, the Eastwick neighborhood in Philadelphia, and the Woodlawn neighborhood on the south side of Chicago, are arguably exactly the sorts of communities the tool was intended to identify.
As a result, the White House received an avalanche of comments critiquing the prototype. More than 2,300 people wrote in, and the vast majority demanded that the tool explicitly consider race in order to include more communities of color. After taking these comments into consideration, the White House quietly released an updated version of the tool in late November.
Here’s how the tool now works. It first computes a slew of socioeconomic and environmental statistics for every census tract in the country. These metrics include a tract’s income and whether it is near legacy pollution sites, close to heavy traffic, and has a high projected flood or fire risk, among others. If a tract meets one each of the tool’s socioeconomic and environmental burden thresholds, it is considered disadvantaged. Based on the suggestions of several researchers and advocates, the new version also now automatically considers more than 750 federally recognized tribal tracts disadvantaged, refines its income formula, and adds nine new criteria for judging whether a neighborhood is disadvantaged, including whether it is flood- or wildfire -prone, lacks green space, and is near abandoned mines. Additionally, if a tract is surrounded by disadvantaged communities and is at or above the 50 percent threshold for low income, then it is also automatically considered disadvantaged, even if it fails to meet the environmental thresholds.
The changes led to an addition of roughly 4,400 census tracts to the ranks of the disadvantaged. As a result, 37 percent of the country’s nearly 74,000 tracts are now considered disadvantaged by the tool — up from 32 percent in the initial version. Those tracts are home to about 109 million Americans.
The White House “was really responsive to community feedback,” said Justin Schott, a project manager at the Energy Equity Project at the University of Michigan, a group researching ways to improve clean energy access for communities of color. “I was impressed by the breadth of new datasets that they took on.”
Like in the beta version, the “disadvantaged” designation in the revised tool remains highly correlated with race: The larger the share of people of color in a tract, the more likely it is to be flagged. A recent E&E News analysis also found that the tool identified more than three-fourths of all U.S. tracts where Black and Hispanic residents make up a majority as disadvantaged.
But a Grist analysis has found that the addition of new data and methodological changes did not dramatically alter the tool’s effectiveness at capturing communities of color shouldering environmental burdens. In fact, some advocates argue that the tool’s focus on communities of color has actually been diluted by the addition of many rural, majority-white tracts.
Of the roughly 4,400 disadvantaged tracts added in the new version, just 37 percent of the population are people of color. Conversely, the roughly 650 tracts that lost their status as disadvantaged had a population that’s 57 percent non-white. In total, about 800 tracts that are majority non-white were added as disadvantaged. At the same time, the number of tracts with a population that is 90 percent or more white increased by nearly 1,000.
“The changes they made, and I think inadvertently, in my opinion, ended up making the program less focused on people of color than it originally was,” said Bob Dean, CEO of the Center for Neighborhood Technology, a Chicago-based nonprofit that has been assessing the tool over the last year.
A spokesperson for the White House Council on Environmental Quality did not respond to specific questions, but said that the new version of the tool “adds new datasets to better reflect the burdens that communities face in response to feedback from Tribal Nations, the White House Environmental Justice Advisory Council, environmental justice stakeholders, and others.” While the tool does not include race explicitly, it reflects “on-the-ground burdens and realities that disadvantaged communities face,” she said.
There are a few reasons why the new version appears biased toward less diverse tracts. Some of the newly added criteria for inclusion — such as risk of flooding, homes without a kitchen or indoor plumbing — appear to prioritize whiter communities. For example, of the more than 4,400 tracts newly included as disadvantaged, about 500 were selected because people who live in these tracts had inadequate access to transportation. However, only 27 percent of the people in these tracts are non-white — considerably lower than the average non-white population in disadvantaged tracts in both versions of the tool.
Dean said it was likely the transportation access criteria was causing the tool to pick up a number of rural tracts where public transit is scarce. “You end up with people traveling a very long way to get to work and being dependent on cars and having to maintain a car for work because there is no transit alternative,” he said. “And those places are majority white.”
In order to assess the difference between the old and new versions of the tool, Manuel Salgado, a research analyst at WE ACT for Environmental Justice, a community advocacy group based in New York City’s Harlem neighborhood, analyzed the racial makeup of the disadvantaged tracts. He found that the percentage of Latino, Black, and Asian residents in disadvantaged tracts decreased in the new version, but the percentage of white residents increased. The proportion of non-Hispanic/Latino white population increased by more than 4.5 percentage points in the new tool, while the proportion of Black and Latino populations decreased by 1.8 and 2.8 percentage points respectively.
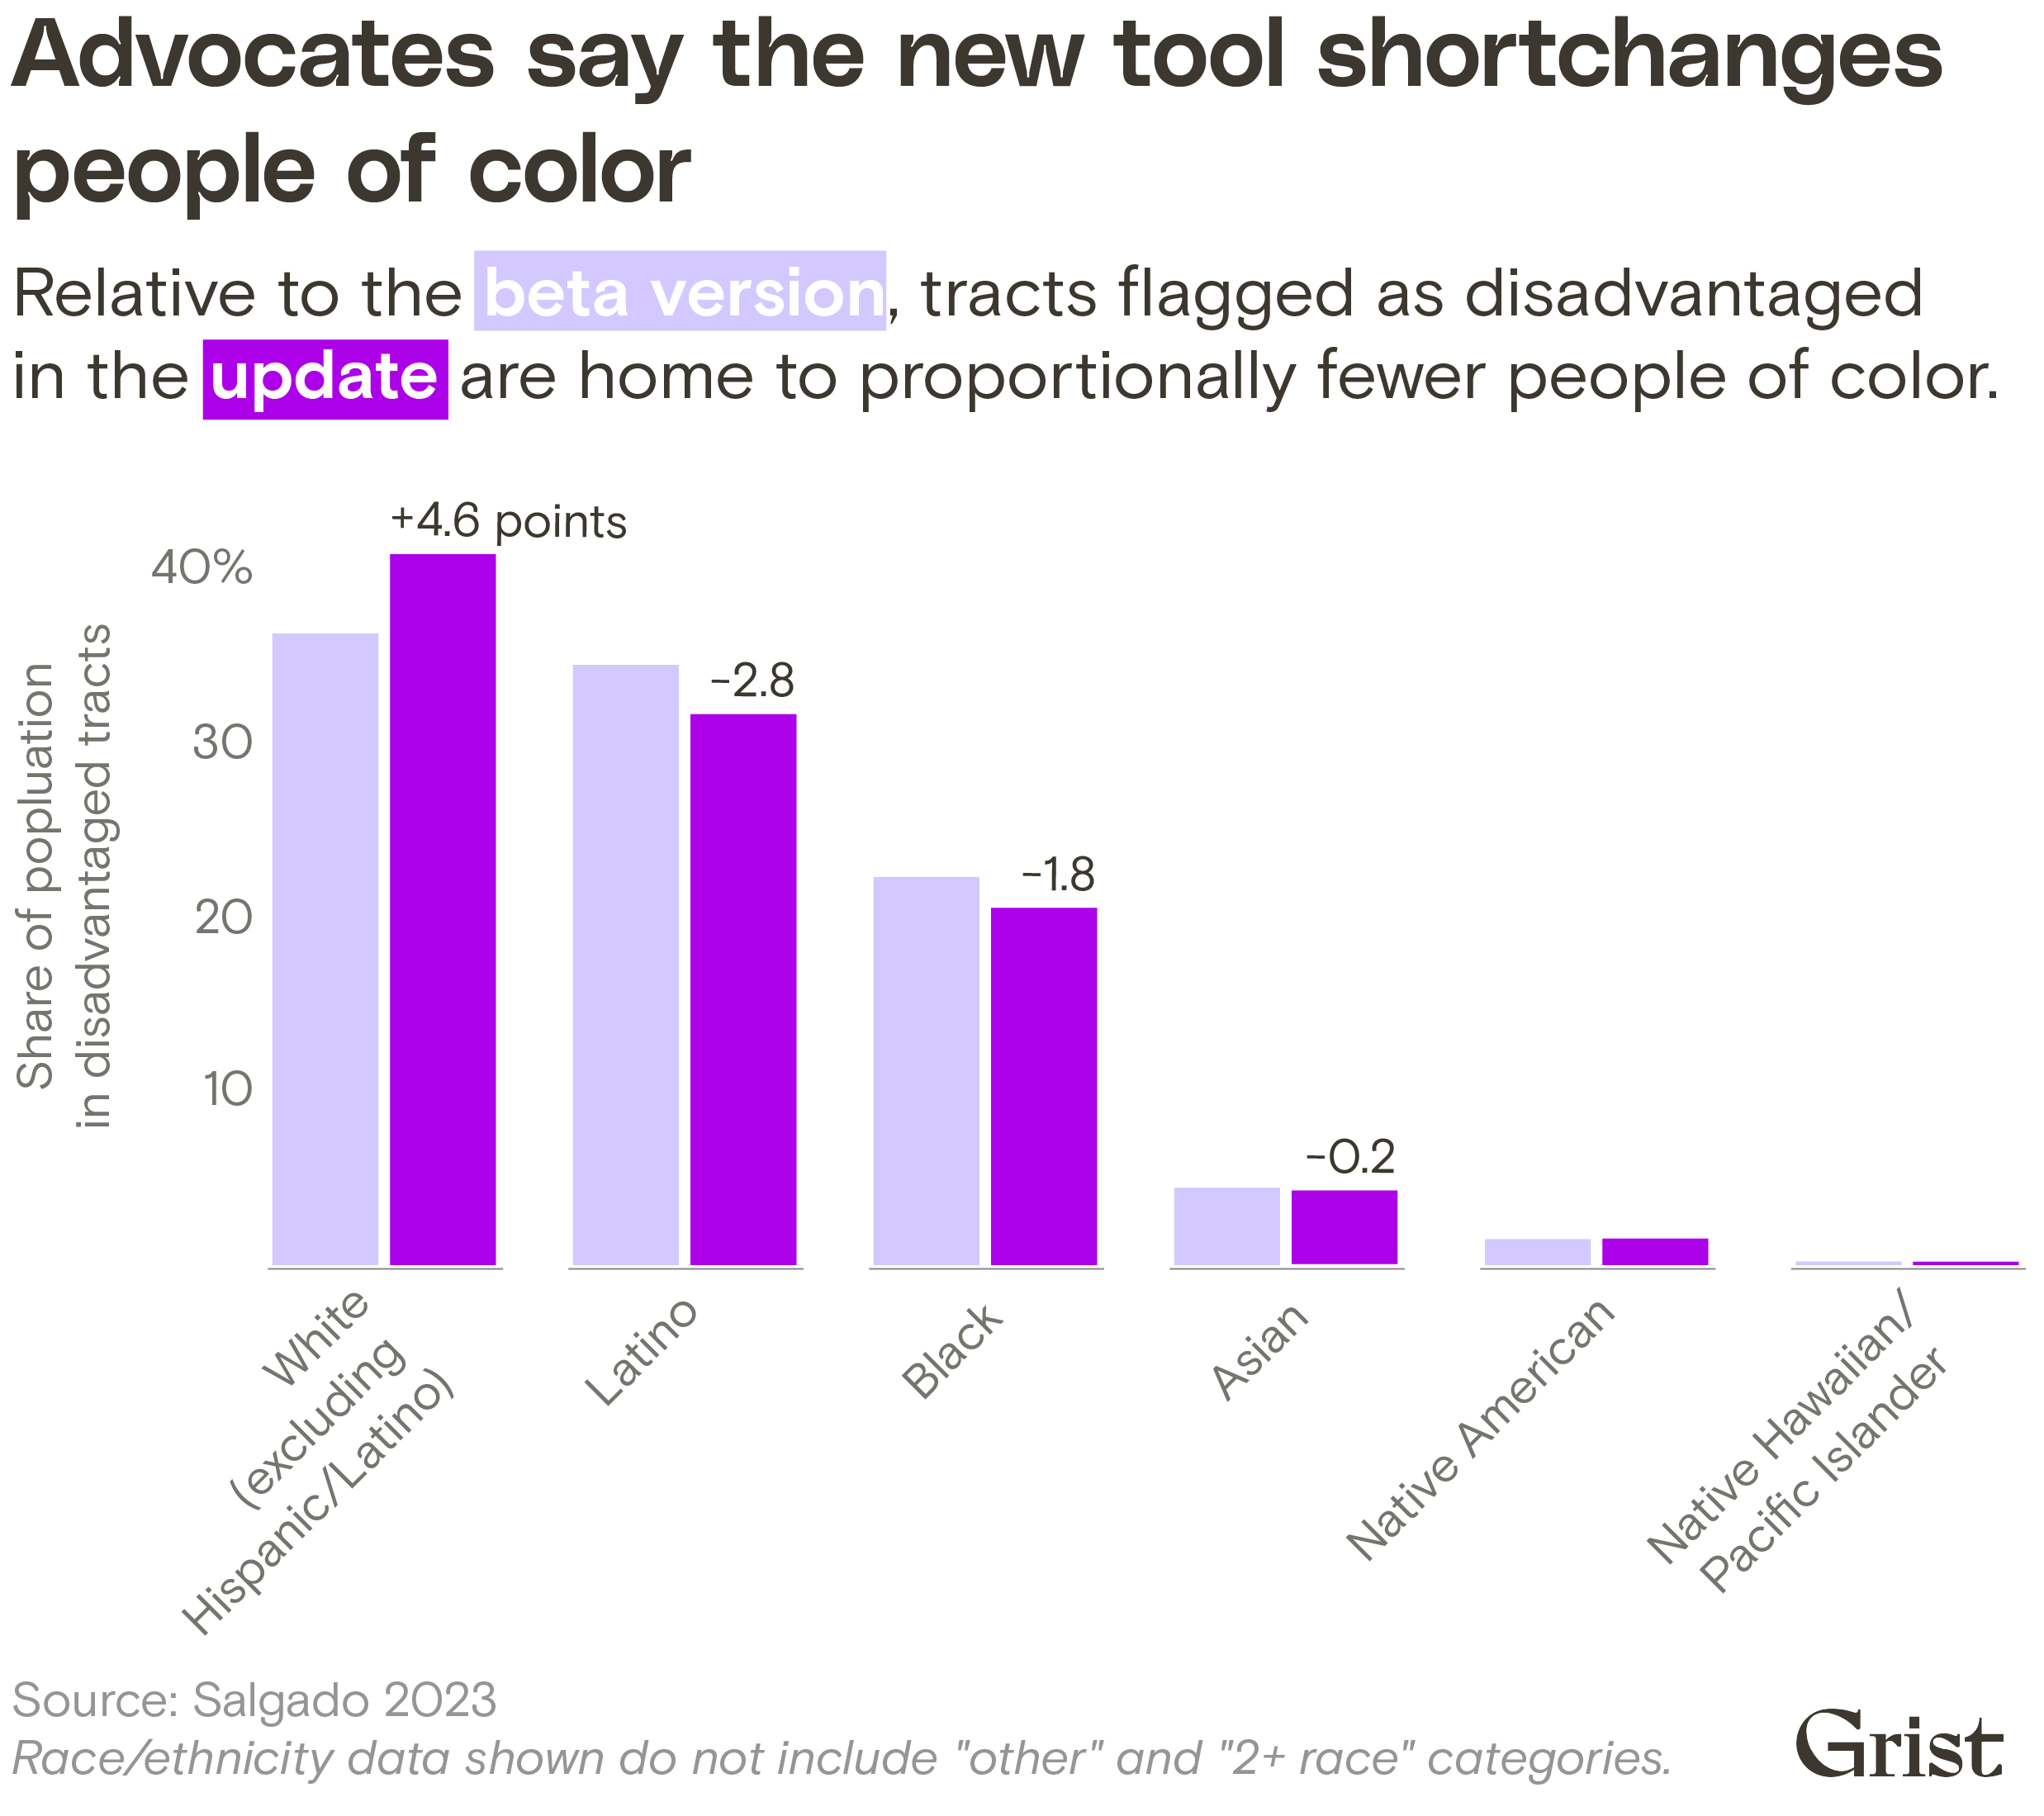
“The new additions as far as people are concerned were so predominantly white, it dilutes the impact that the tool has in general on communities of color,” said Salgado. “There’s potential here, but on its own, I don’t necessarily view it as a positive change.”
Overall, the tool now considers many more rural communities disadvantaged. In a webinar announcing the new version of the tool in November, Sharmila Murthy, the White House Council on Environmental Quality’s senior counsel said that nearly a third of rural communities were now considered disadvantaged — compared to just 23 percent in the earlier version. The inclusion of many more rural communities was likely driving the demographic changes in the new version, Salgado said.
During the comment period, environmental justice groups advocated that the White House use redlining data in order to pull in more diverse communities. In the 1930s, the federal government created color-coded maps that designated certain neighborhoods as risky areas to invest in. These redlining maps resulted in historic underinvestment in communities of color. Environmental advocates hoped that including redlining data would be a closer proxy to race — but that didn’t bear out. In effect, the redlining criteria only pulled in an additional 21 tracts with a population of roughly 75,000, according to an analysis by the Center for Neighborhood Technology.
That’s because of the tool’s methodology and how the data is used. CEJST requires that each criteria be considered alongside a socioeconomic variable. In this case, the redlining threshold is only met when a tract has both experienced historic underinvestment and is at or above the 65th percentile of a low-income measure. More than 1,100 redlined tracts weren’t included because they failed to meet that income threshold.
That’s the case in the East Bronx in New York, where one tract has a population that is 99 percent non-white, including a nearly 80 percent Black population, was redlined, has a large share of the population suffering from asthma, is exposed to high levels of particulate matter from diesel exhaust, and is close to a leaky underground storage tanks. But it’s not considered disadvantaged by the tool because its income score is 64 percent — just below the 65 percent threshold. Salgado advocated for lowering the income threshold for formerly redlined tracts. Decreasing the threshold to 50 percent would bring in an additional 254 tracts, he found.
Environmental justice experts Grist spoke to argued that the tool would identify more qualified communities of color if it took a more cumulative approach. Currently, for example, the tool doesn’t distinguish between tracts that meet multiple environmental thresholds and those that meet just one. Analyses by Salgado and researchers at the Environmental Policy Innovation Center, a conservation group, also found that tracts that are facing multiple environmental burdens are also more likely to have larger Black populations.
When they looked at the racial breakdown of disadvantaged tracts, those that meet three or more of the tool’s thresholds contain two-thirds of the Black disadvantaged-tract population and more than half of the Latino disadvantaged-tract population. Conversely, tracts where only one or two thresholds are met have larger white populations. Given this, a cumulative impact approach might pull in more Black and Latino tracts if it relaxed the income threshold in cases where multiple environmental burden thresholds are met.
“The cumulative impact component would allow [the tool] to better capture those communities of color who are currently not captured and also really look at the magnitude of disadvantage,” said Sacoby Wilson, a professor at the University of Maryland who helped the state of Maryland develop its own environmental justice screening tool.
Murthy, the White House counsel, said that the tool will continue to be refined and that they are “eager to be improving the methodology to better reflect cumulative impacts in future versions of the tool.” The White House is currently working with an advisory council and a study committee to implement these changes. A guidance document released by the White House last month also noted that while a methodology to assess cumulative burdens is being built, “agencies have discretion to prioritize communities in a way that approximates this goal.”
“We anticipate that future versions of the tool will be able to identify communities that are disproportionately bearing these cumulative impacts,” Murthy said.
This article originally appeared in Grist at https://grist.org/equity/white-house-environmental-justice-tool-cejst-update-race/.
Grist is a nonprofit, independent media organization dedicated to telling stories of climate solutions and a just future. Learn more at Grist.org