
How you should invest your TSP funds will depend on one’s investment time horizon and tolerance for market gyrations. tommy/Getty Images


The C Fund at 35: Trust the Long-Term Data When Investing in the TSP
For people invested in the federal government’s 401(k) style retirement plan, guest columnist Lee Radcliffe says long-term data from U.S. market history provides valuable lessons.
The Thrift Savings Plan’s C and F Funds turn 35 in January, having initially opened for contributions in January 1988. The funds, based on indexes of the S&P 500 – approximately 500 of the largest companies listed in the United States – and U.S. investment-grade bonds respectively, followed closely after the initial opening of the U.S. government bond-based G Fund in April 1987.
Over the ensuing years, the three original funds have enjoyed different rates of growth, with the C and F Funds sometimes also suffering steep declines in value. It’s easy to enjoy fund growth when the economy is great and markets are funds are growing, but during long and drawn-out market declines, the common question is: What should we do with our TSP investments?
While part of the answer depends on one’s investment time horizon and tolerance for market gyrations, for those invested in the TSP stock funds, the long-term data from U.S. market history provides valuable lessons, particularly for the C Fund.
First: Don’t sell during declines.
Second: Continue investing regularly via payroll deductions into the stock funds.
Third: don’t pay too much attention to the day-to-day headlines about market performance.
Here’s some of the data that show us why.
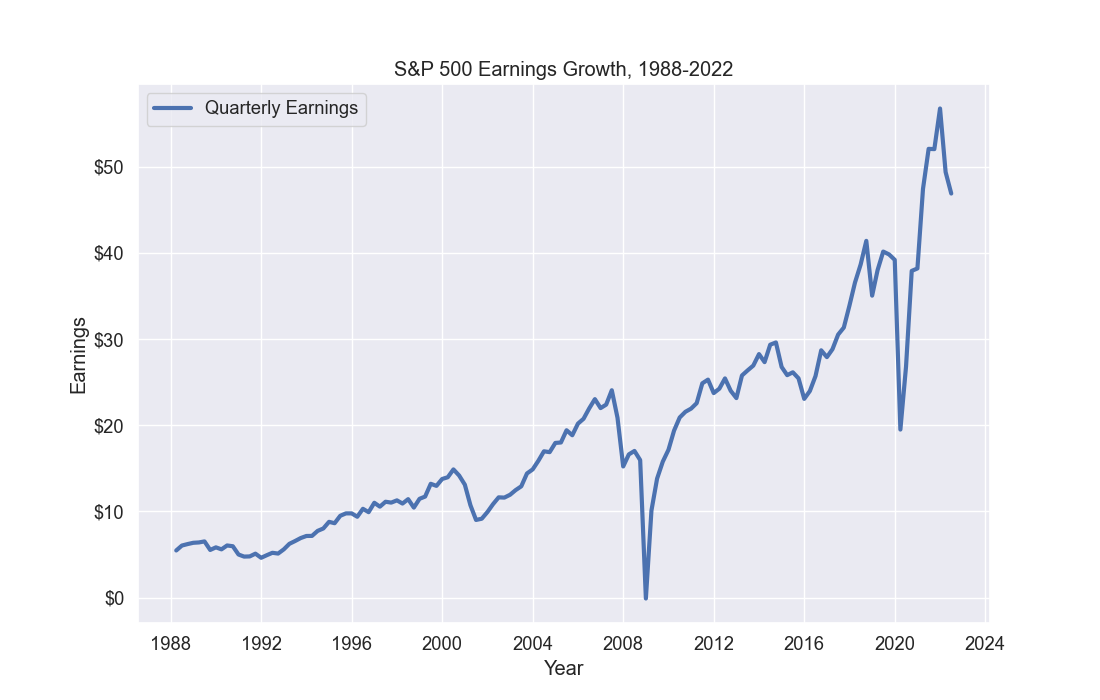
First, look at earnings and dividend growth of the S&P 500/C Fund over the past 35 years. This timeframe includes a short recession in the early 1990s, the “irrational exuberance” of the late 1990s, and major declines in the early 2000s and the “Great Recession” of 2007 to 2009.
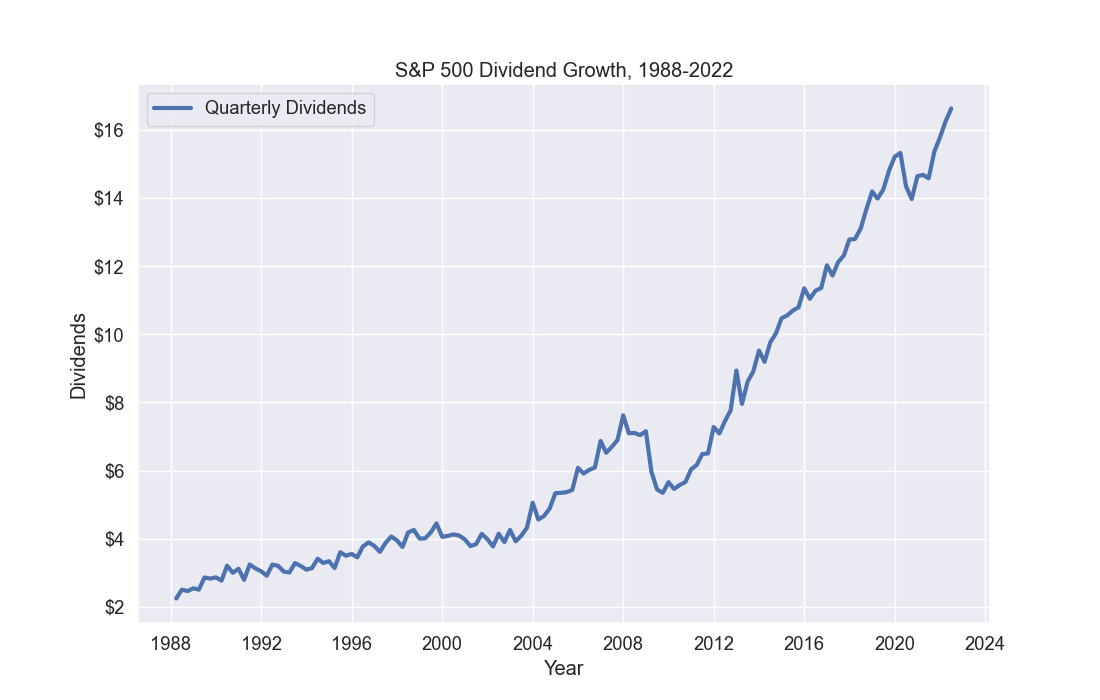
Over the long term, S&P earnings grew from just over $5 in the first quarter of 1988 to a peak of over $50 per share at the end of 2021, according to S&P data. Dividends, a particularly good indicator of companies’ health, rose steadily from $2 in 1988 to over $16 this year. Here are charts of quarterly earnings and dividend growth through mid-2022:
Despite some significant declines, after each challenging period the U.S. free market economy proved its dynamism and returned to long-term growth.
What does this look like for regular investors?
Using real TSP data from the beginning of 1988 – when the C and F Funds first started accepting contributions – if an investor had invested just $100 in January 1988 and contributed $100 every month – for a total of $41,900 over those years – here is how that investment in the funds would have grown through November 2022:
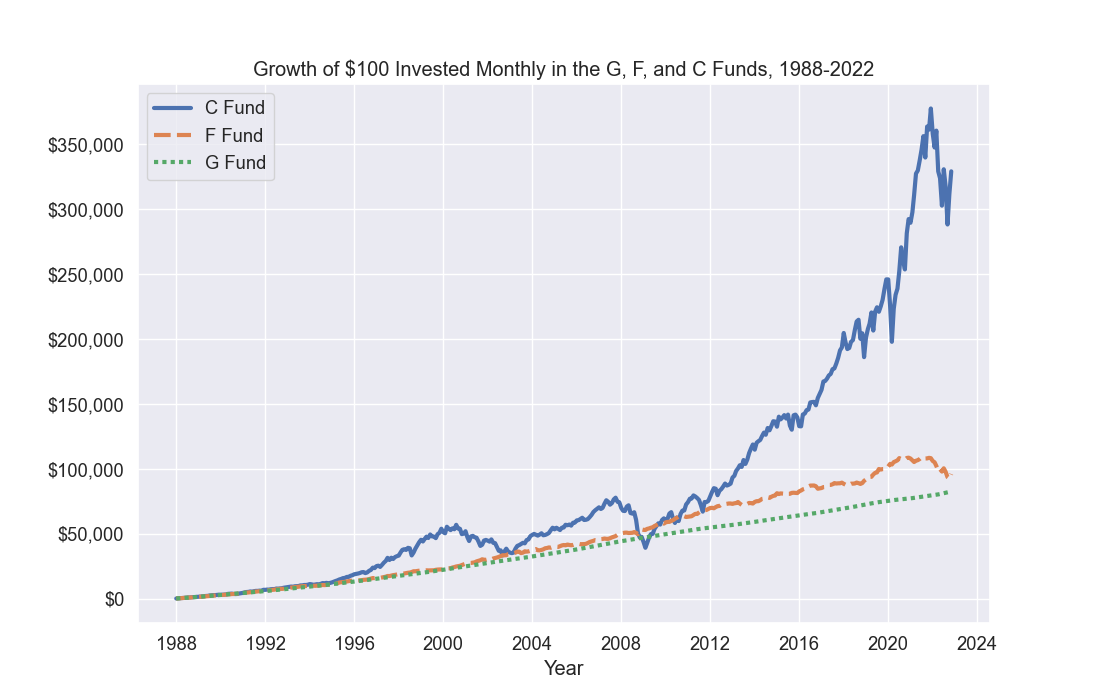
There were dips here and there – and some major declines, too. But sticking with a regular investment plan, without selling or trying to time market fluctuations, provided nice returns especially in the C Fund.
This has been the case for broad U.S. equities indices over the past 120 years. While the results vary, after 30 or more years of regular investing via monthly contributions (“dollar-cost averaging”) over any given period since 1900, the results can be astounding for buy-and-hold investors investing in broad index funds, as detailed in TSP Investing Strategies.
For example, how would a typical investor have fared during a similar past era of aggressive inflation, high energy prices, an uncertain housing market, and a Russian invasion of a neighboring country? Namely, during the 1970s and early 1980s?
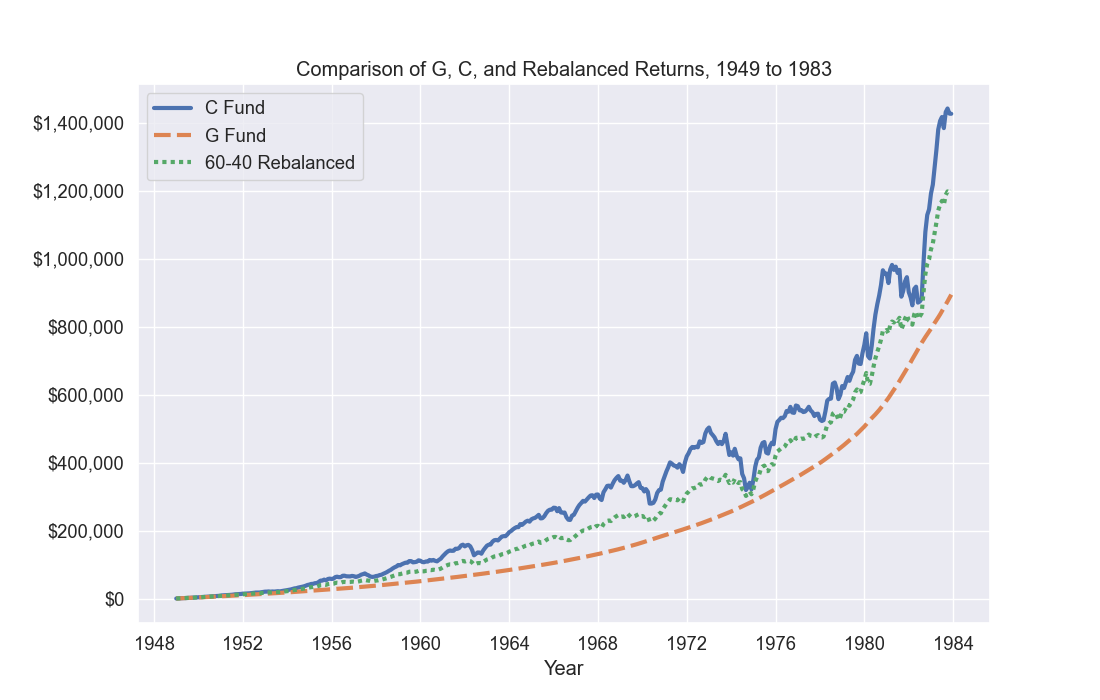
Using actual market data, I ran multiple scenarios for an investor during a 35-year career, investing in either the S&P 500, or a stable value fund equivalent to the monthly interest rate for the U.S. 10-year bond (representing the G Fund). I also ran scenarios for a more balanced portfolio, with 60% of contributions going to the S&P 500, and 40% going to the stable fund.
For the scenarios, the hypothetical investor started investing $250 a month -- equivalent to a 5% contribution for a TSP participant making $30,000 a year, and a 5% government match. The total contribution rate increased by 5% each year.
Here is an illustration of the hypothetical investor’s growth in assets, first from 1949 to 1983 – ending just as we came out of the early-1980s recession:
Here is a chart of example returns from investing monthly in each portfolio from 1959 to 1993, as the U.S. exited from a recession in the early 1990s:
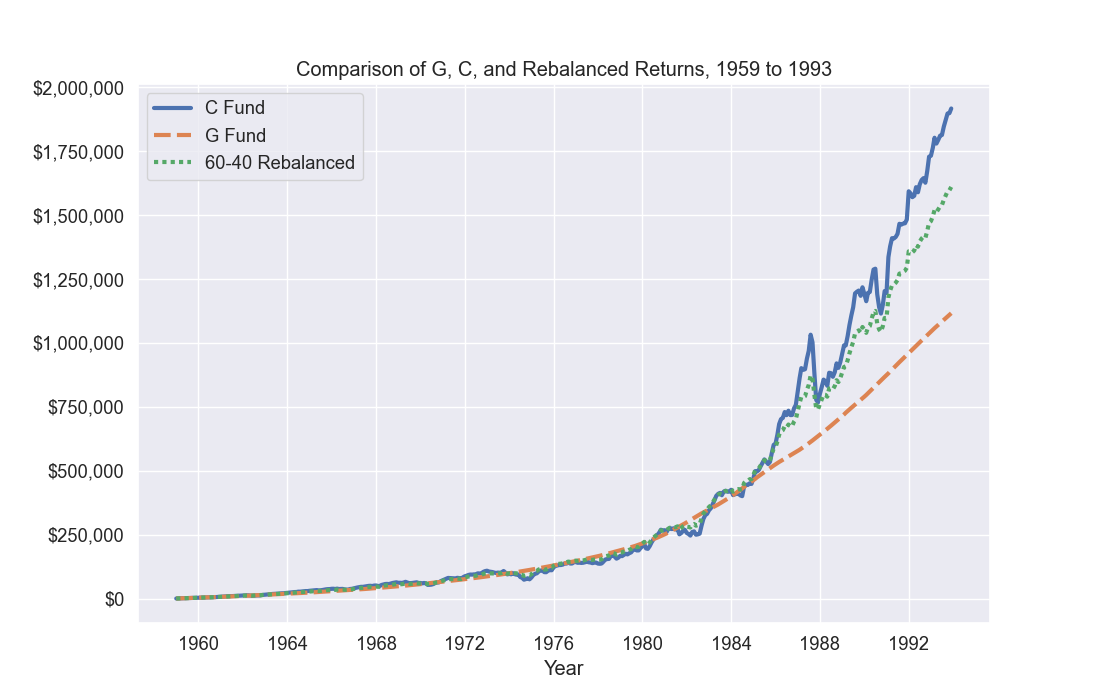
In each case, there are notable dips in total fund value for the C Fund and the balanced portfolios, especially later in the investing activity.
But in each case, coming out of the era of low returns, market dynamism returned to the U.S. economy in the 1980s and again in the 1990s, and investors who stayed the course enjoyed significant rewards.
I believe the lesson is clear: Trust in the long-term dynamism of the U.S. free-market economy. For those with long time horizons, stay invested particularly in your stock funds, and keep investing during downturns. While there will be declines in value from time to time, the long-term results will amaze you!
About the author: A U.S. Army Reserves veteran with 20 years of federal government experience, Lee has been writing and researching about investing in the TSP for over ten years. His work has been published in GovExec.com, federalnewsnetwork.com and FedSmith.com, and his most recent book is TSP Investing Strategies: Building Wealth While Working for Uncle Sam, 2nd Edition (Thrift Strategies LLC, 2020). Follow the project at tspstrategies.com and @TSPstrategies on Facebook, Twitter, and Instagram. Data and methodologies used in this article are detailed in the GitHub repository at https://github.com/TSPstrategies/TSPCFundat35.