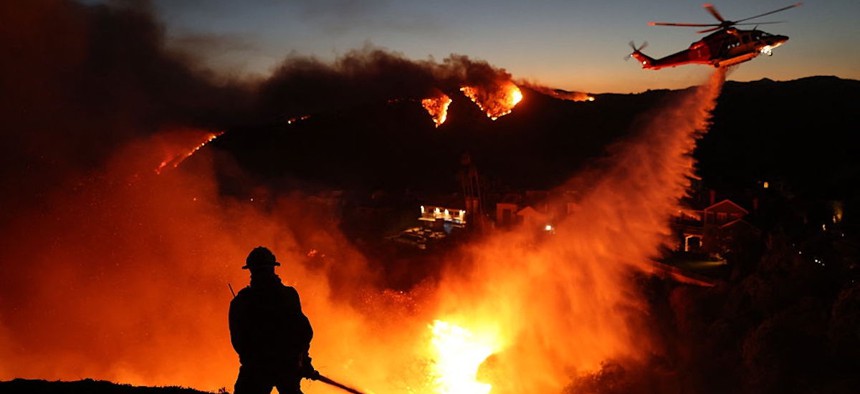
Fire personnel respond to homes destroyed while a helicopter drops water as the Palisades Fire grows in Pacific Palisades, California on January 7, 2025. David Swanson / AFP via Getty Images


When disaster strikes, census data can help show who is in harm’s way
The agency’s updated OnTheMap for Emergency Management tool shows how population and workforce data can support rapid response and recovery operations during hurricanes, floods, wildfires and other natural disasters.

When hurricanes approach the coast or wildfires tear through dry terrain, the first maps that most people see are the ones that track the danger itself. They show a storm’s path, the current fire perimeter or zones that might soon flood. But for emergency managers, those maps answer only part of the question. Just as important is having a fast way to estimate how many people live and work in the affected area, and which communities may face the greatest challenges.
That is where an unlikely federal agency comes in. The U.S. Census Bureau recently updated its OnTheMap for Emergency Management tool, which gives users access to population and workforce data for areas affected by natural disasters. The interactive map combines current disaster-event boundaries with the latest available Census population, housing and workforce data to help officials estimate who lives and works in affected areas. Version 4.26.1 adds the latest 2020-2024 American Community Survey five-year estimates and the 2023 Longitudinal Employer-Household Dynamics Origin-Destination Employment Statistics data, giving planners a more current view of the communities they may need to protect or help rebuild.
At first glance, Census may seem like an unusual player in a disaster-response situation, even compared with other government-driven first responder initiatives. Most people associate the bureau with long-term demographic analysis, housing trends, migration patterns and the economic snapshots that fuel research, planning and political debate. But that is exactly what makes this tool so interesting. It shows how data often used to explain slow-moving change can also serve a far more immediate public-safety purpose.
The Census Bureau’s Emergency Management Hub makes that mission explicit. It presents tools and resources meant to support planning, preparedness and recovery, including OnTheMap for Emergency Management, My Community Explorer and Community Resilience Estimates. All three interactive maps work together to help humanize disasters and responses to them. In other words, the agency is not just counting people. It’s helping officials understand where people live, where they work and which communities may face greater challenges before, during and after a crisis.
A good example comes from North Carolina. Using Community Explorer, users can click on a recent wildfire, such as the Byrd Road Incident, which was being fought as I was writing this column. Clicking on the incident shows that the fire was eventually contained on March 7 after burning 10 acres, but also the broader community context around it. It was a fairly small fire compared with many others on the map, but gives a good look at the kind of information that the Census maps can provide to both first responders and post-disaster aid workers.
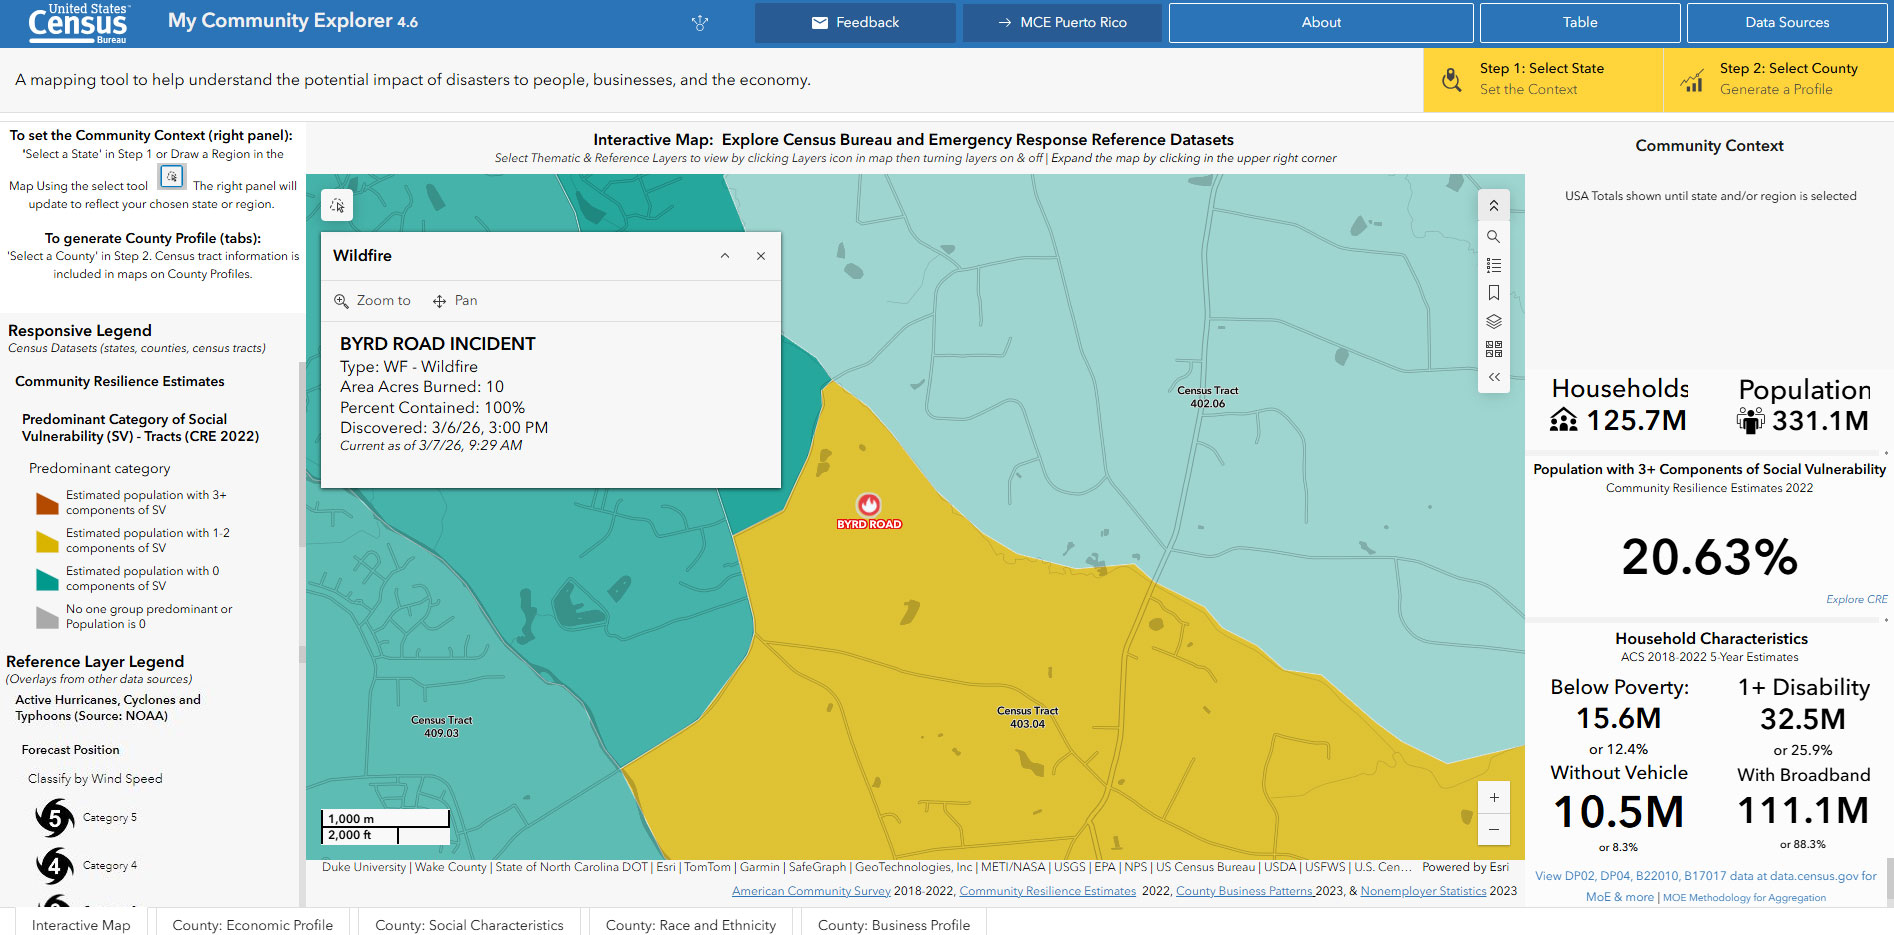
For example, the area surrounding the Byrd Road Incident shows Wake County, where there are 430,000 households. It also indicates that 14% of them have some type of social vulnerability that could make recovery more difficult. That includes households without cars (17,000), people living below the poverty line (33,000) and households where someone with a disability lives (78,000).
That matters because modern emergency management depends on more than tracking the event itself. Weather data can show where a storm is headed. Satellite imagery can show where a fire is spreading. But officials also need a human map. They need to know how many people live in an affected area, how many workers commute into it and what kinds of households and vulnerabilities may shape evacuation, sheltering and recovery. Census data is well suited to answer those questions if presented through an interactive tool rather than buried in static tables or spreadsheets.
The OnTheMap for Emergency Management tool and its companion maps are designed for exactly that purpose. They provide population, housing and workforce information for areas affected by hurricanes, floods, wildfires, winter storms and federal disaster declarations. Census has also described it in training materials as a way to assess how natural disasters affect local populations, housing and workforce conditions, which underscores that this is not just a side project or a public-facing dashboard. It’s now part of a broader effort to make federal Census data useful while events are still unfolding.
There is also a subtle but important shift in thinking behind this. Government technology discussions often focus on what is new, from artificial intelligence to autonomous systems to predictive analytics. Those tools have their place. But some of the most useful innovations come from rethinking the purpose of data the government already has. In this case, Census is taking information better known for describing communities over time and making it relevant in moments when time is in short supply.
Even NOAA has a supporting role in that new ecosystem. Its Digital Coast site points users to the broader OnTheMap application and describes the emergency management version as an offshoot of that tool. That is a small detail, but it reflects something important about federal disaster technology. No single agency holds the whole picture. The best public tools often emerge from an ecosystem in which weather, geography, population and workforce data reinforce one another.
In 2026, disaster response is no longer just about tracking a storm, fire or flood. It’s also about understanding the people inside the disaster zone. Through tools like OnTheMap for Emergency Management, the Census Bureau is helping turn federal data into operational awareness. In an era of stronger storms, longer fire seasons and growing strain on local responders, that may be one of the most innovative public-safety uses yet for information that most Americans encounter only as tables, charts and dry demographic snapshots.
John Breeden II is an award-winning journalist and reviewer with over 20 years of experience covering technology. He is the CEO of the Tech Writers Bureau, a group that creates technological thought leadership content for organizations of all sizes. Twitter: @LabGuys