


Animation: Watch the Remarkable Expansion of American Obesity
A new graphic using CDC data shows larger waistlines across the United States.
The United States isn’t the world’s fattest country—that distinction goes to Tonga—but it’s up there, with two-thirds of its adults classified as overweight or obese.
But it didn’t used to be so heavy, as evidenced in this animated map from Metrocosm’s Max Galka (the same guy behind that fascinating visualization ofUFO sightings). Using state data from the CDC, Galka shows how trends in obesity (having a BMI equal to or above 30) have shot up since the mid-1980s. Regional patterns shift through time, but basically the entire country has experienced a major, belt-loosening expansion—look for the South frequently leading the charge, perhaps influenced by its heart-hammering cuisine.
What’s to blame for the big broadening? “The USDA keeps promoting the ‘calories in, calories out’ model, which makes the solution to obesity seem simple: eat less/exercise more,” emails Galka. “However, there is now a lot of research showing this model to be false.” He cites evidence linking obesity toviruses, bacteria, and hormone-altering chemicals. Of course, there’s also the global boom in cheap, shrewdly marketed junk foods.
“The obvious culprit is processed starches, which pretty much everyone is aware of now,” Galka says. “But there may be other contributing factors, too, some of which sound pretty crazy.” (It doesn’t help, he adds, “that the sugar industry keeps promoting bad science.”)
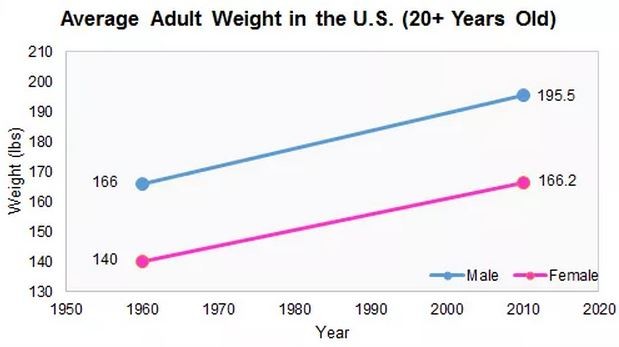
Nowadays the average 5-foot-8 American man weighs 196 pounds with a 40-inch waist; a 5-foot-3 woman is typically 166 pounds with a 38-inch waist,according to the CDC. Galka has put those proportions in historical context with a couple other illustrations. The first is this comparison of weights by sex from 1960 to the near-present. “The average woman today weighs as much as the average man in 1960,” writes Galka:
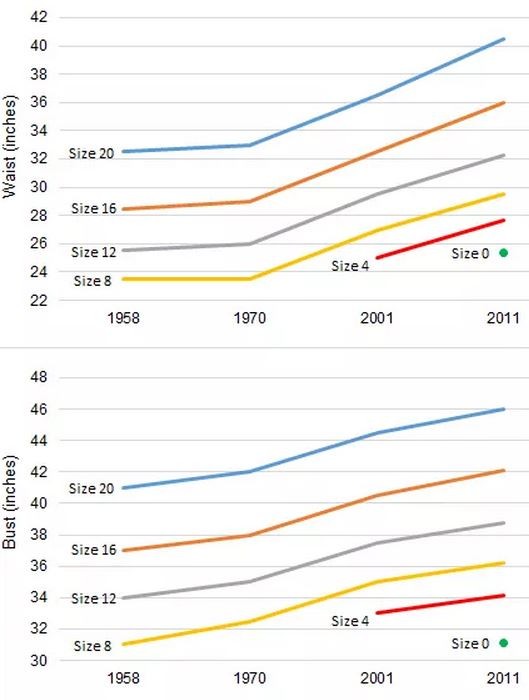
“Today’s size 0 dress is larger than a size 8 in 1958,” he writes by way of introducing these charts of waist-and-bust sizes:
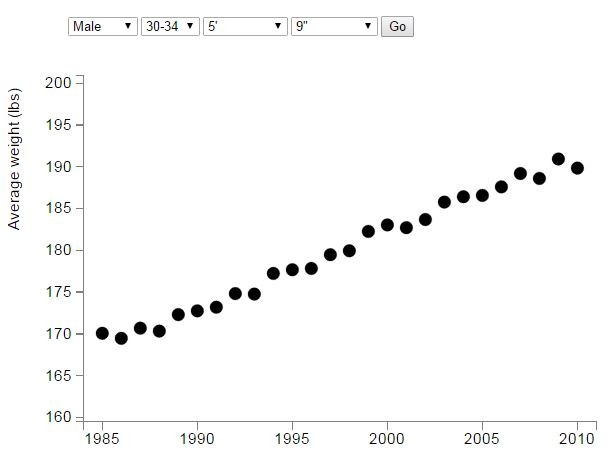
Galka’s also made a tool revealing how differently built people have put on weight over the years. Shown here is the average 5-foot-9, early-30s guy going from 170 to more than 190 pounds since the 1980s. Head over to Metrocosm to check your own population segment:
(Top image via C Levers/Shutterstock.com)
NEXT STORY: Why the Government Doesn’t Work