Image via Steve Cukrov/Shutterstock.com


Infographic: Who Actually Votes in America?
An interesting snapshot of who takes advantage of the right to vote in the U.S.

Tomorrow is election day in America. Braving long lines, the cold and their own apathy, millions of Americans will head to the polls and cast a ballot for either Barack Obama or Mitt Romney. But, despite being the country that first made this whole voting thing popular, voter turnout in the United States is, in a word, abysmal--especially when compared to other countries.
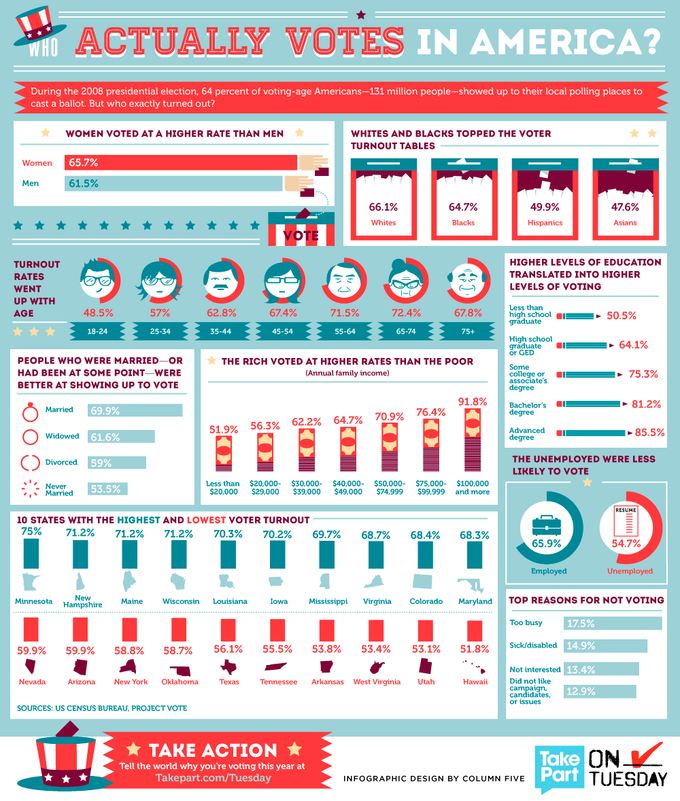
In 2008, 64 percent of voting-age Americans--131 million people--cast a ballot and made their voices heard. That was the most, ever, to vote in a presidential election. Citing a lack of enthusiasm, a recent Gallup poll taken before Hurricane Sandy indicates that turnout in 2012 might be lower than in the previous three elections.
But of those who do show up or cast an early ballot, who are they? Using data from the 2008 election, TakePart.com put together an infographic exploring that question.
A few interesting nuggets of information they found:
Top Five - Highest Turnout by State:
- Minnesota
- New Hampshire
- Maine
- Wisconsin
- Louisiana
Low Five - Lowest Turnout by State:
- Hawaii
- Utah
- West Virginia
- Arkansas
- Tennessee
Other facts:
- Women voted at a higher rate than men.
- The older the voter, the higher the turnout rate.
- The unemployed vote less than the employed, and the rich vote more than the poor.
- By race, whites and African-Americans vote the most.
- Those who are married, or have been, are more likely to vote.
- Most common reason for not voting? "Too busy," followed by "sick/disabled" and "not interested."
See the infographic below:
What do you think of voter turnout in America? How can it be improved?
(Image via Steve Cukrov/Shutterstock.com)
NEXT STORY: Election Day is Tomorrow: What You Need to Know