A Decade After McCain-Feingold, Election Spending Spikes
Next year's midterm elections expected to cost around $3.5 billion.
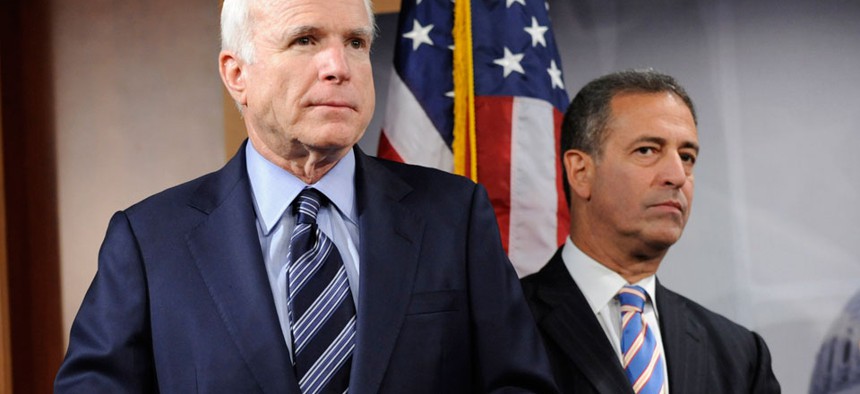
A decade after Sens. John McCain and Russ Feingold spearheaded sweeping campaign finance reform legislation, a series of judicial and legislative setbacks have derailed any hopes its original sponsors had of curbing the influence and amount of money spent on politics.
Instead, the incredible explosion of money in federal elections demonstrates McCain-Feingold was a speed bump, at best, on the way to a dramatic growth curve that suggests next year's federal elections will cost nearly $3.5 billion.
All told, candidates running for a seat in the House of Representatives spent more than $923 million in 2012, while candidates running for Senate seats dished out $587 million, according to new data compiled for the new edition of Vital Statistics on Congress. That's more than eight times the amount House and Senate candidates spent in 1980. Senate candidates spent twice what they did a decade ago, in 2002.
The average member of Congress spent $1.59 million to win his or her seat, the data show. That's more than double the $753,274 the average winning candidate spent in 1986, in 2012 dollars. Senate candidates spent 61 percent more, $10.3 million, than they did in 1986, again adjusted for inflation.
Even those numbers understate the amount of money it takes to win a competitive election. The vast majority of members of Congress win re-election easily, given partisan gerrymandering that limits the number of truly competitive House districts around the country. Eliminate members in non-competitive races -- Texas GOP Rep. Sam Johnson spent $972,000, while Florida Democratic Rep. Frederica Wilson spent $554,000; both received 100 percent of the vote -- and the amount spent on contested races inches higher. The average incumbent who won with less than 60 percent of the vote spent $2.25 million in 2012, according to the data, while the average incumbent who lost a re-election bid dished out $3.1 million. A challenger spent an average of $1.52 million to get elected in 2012.
Candidates running in each of the five most expensive races last cycle spent a combined total of more than $10 million, according to data compiled by the Center for Responsive Politics. Two of those House seats, held by Florida Democrat Patrick Murphy and Connecticut Democrat Elizabeth Esty are likely to be battlegrounds again next year. House Speaker John Boehner qualifies as a top spender; his campaign spent a total of $21 million last year, though all but a tiny fraction went to help other Republican candidates. An independent candidate spent $7.5 million of his own money in an effort to oust Democratic Rep. Henry Waxman in a strongly Democratic California district, while Rep. Michele Bachmann's decision to retire will actually help Minnesota Republicans keep her seat.
A key element of the McCain-Feingold reforms that was aimed at reducing the amount of money in politics, a ban on unregulated so-called "soft" money, hasn't slowed either party. In 2002, the last cycle in which parties could raise and spend soft money, the three largest Democratic committees raised a total of $576 million, while their Republican counterparts pulled in $657 million. In the 2012 cycle, limited only to hard-money contributions, Democratic committees raised $631 million and Republican committees pulled in $697 million.
Before McCain-Feingold, parties were allowed to spend unlimited amounts of soft money on party-building activities like registering voters and maintaining their facilities. Most of the $32 million it took to build the Democratic National Committee's headquarters building, just a few blocks from the Capitol, came from the DNC's soft money coffers. Haim Saban and Steve Bing, two big-money Democratic donors, wrote one check each totaling a combined $12 million just months before the ban on soft money went into effect after the 2002 elections.
Since the ban, though, the six major party committees -- the DNC, the Republican National Committee, the Democratic Congressional Campaign Committee, the National Republican Congressional Committee, the Democratic Senatorial Campaign Committee and the National Republican Senatorial Committee -- have dramatically increased the amounts they spend on federal races.
In 2002, the last cycle before the ban took effect, the three Democratic committees spent just $6.4 million on independent advertising and advertising coordinated with the candidates they backed; in 2012, those same Democratic groups dropped $127 million on their candidates. The top three Republican committees went from spending $21.8 million in 2002 to $107 million in 2012. Four of the six committees raised more in 2012, from a more regulated pool of money, than they did in 2002, from the broader, partially unregulated pool (Only the NRSC and the NRCC raised less in 2012 than they did in 2002).
Even when soft money was legal, donors funneled hundreds of millions of dollars in contributions to candidates through political action committees. As far back as 1984, PACs contributed more than $100 million to federal candidates. But since the ban on soft money was put in place in 2002, PAC contributions have jumped as well. In 2012, PACs gave $425 million to federal candidates, double the amount they gave in 1998, according to the figures.
The real explosion in political spending, though, comes from outside groups not technically affiliated with either party. Those independent expenditures have boomed in the wake of Supreme Court and U.S. District Court decisions over the last several years that have permitted unlimited, and at times undisclosed, money to flow into the political process.
At the time it was being debated, opponents of McCain-Feingold warned that eliminating soft money would handicap the two political parties. The new data show they had a point: As late as 1998, outside groups spent just $9.9 million on independent expenditures advocating for or against a candidate. In 2012, outside groups spent $198 million on House races alone, and a staggering $259 million on Senate races. That means outside groups spent $22 million more on Senate races than both political parties spent on all federal races combined.
All told, candidates spent more than $1.5 billion running for the House and Senate last year, organs of the Democratic and Republican parties raised another $1.3 billion, and non-party independent expenditures totaled just over $457 million, for a total of $3.25 billion. If the tremendous growth rate in political spending continues, the perpetual battle to elect a new House and Senate could begin to positively impact the economy.
Keep your checkbooks handy, 2016 is right around the corner.


