NOAA


NOAA Has Mapped a Desktop Model of Earth
Gloriously popping graphics show CO2 transport, real-time earthquakes, space trash, and tons of other neat stuff.
For folks who got super-excited when Google Earth came out, here’s another 3-D model of the world with similarly awesome potential. It’s called the Science on a Sphere Explorer, and it lets you view tons of animated planetary data, from the age of the sea floor to the airborne migration of CO2 to hurricane tracks dating back to 1950.
Science on a Sphere is a NOAA tool that projects different layers on a huge ball, creating a virtual earth you can walk around in museums and classrooms. It’s now available as a desktop program for Windows and Mac, so you can probe natural (and unnatural) phenomena from home in popping, 1920x1080 resolution. Be warned it’s a huge download that eats up to 15 gigs of hard-drive space, though those willing to be patient will reap fantastic rewards.
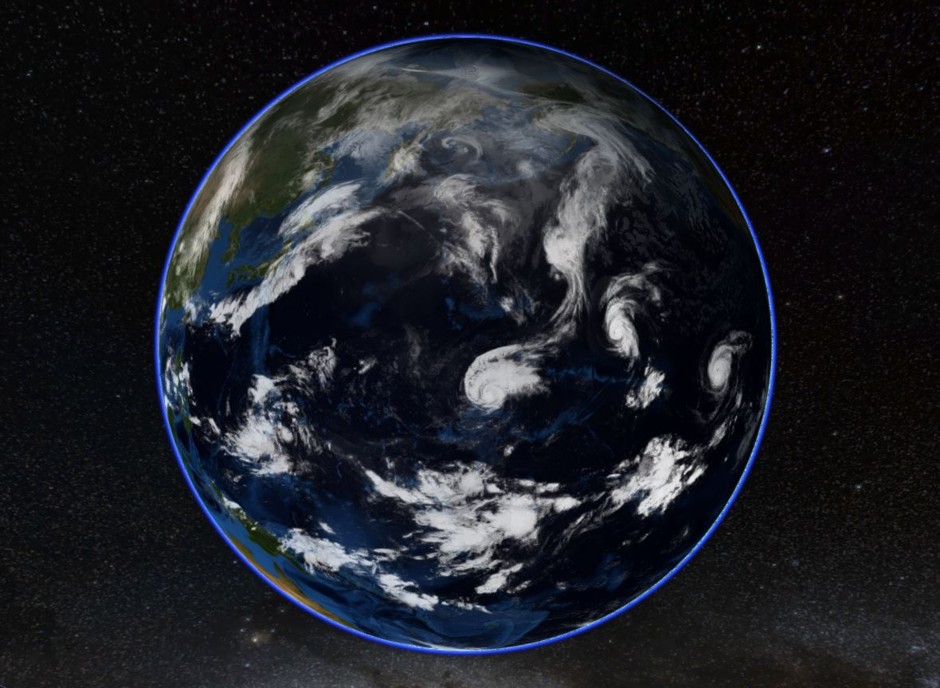
Here are a few of the ways you can explore the planet. Note you can rotate the screen to find and zoom in on any spot on earth. This is the basic Blue Marble view with real-time clouds—peep all those hurricanes in the Pacific:
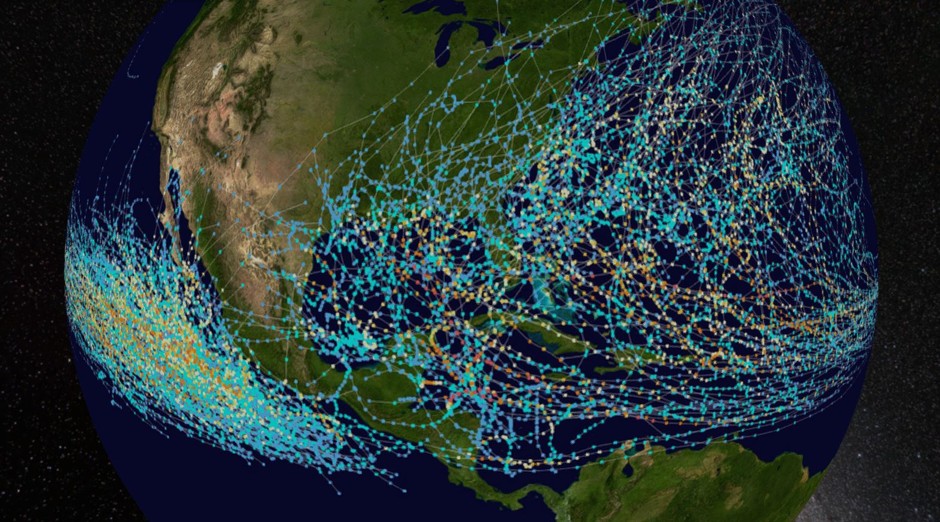
Hurricane tracks from 1950 to 2005 color-coded by strength, red being the strongest and blue being tropical storms and depressions:
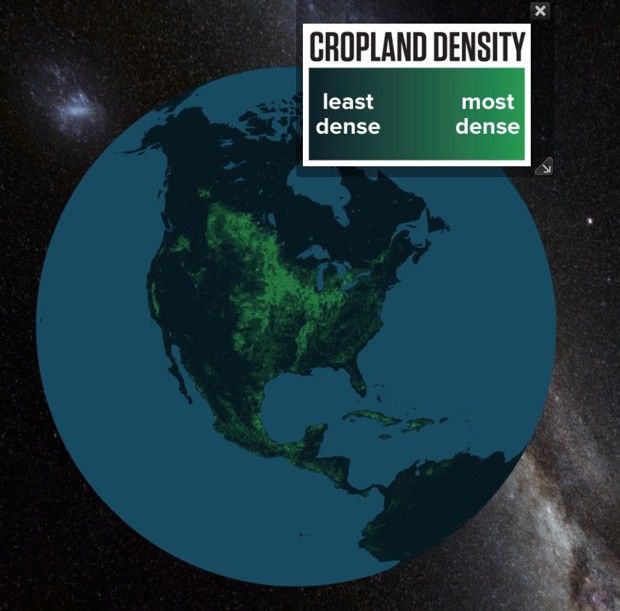
Density of cropland:
The atmospheric transport in 2006 of various aerosols like dust (red-orange), carbon (green), sulfates (white), and sea salt (blue):
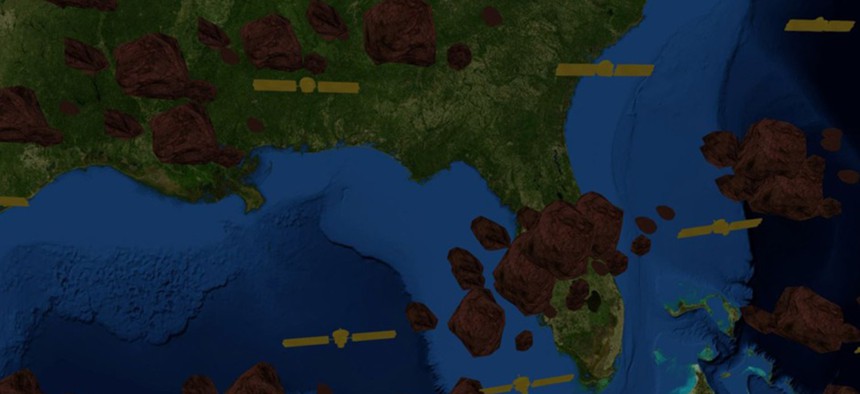
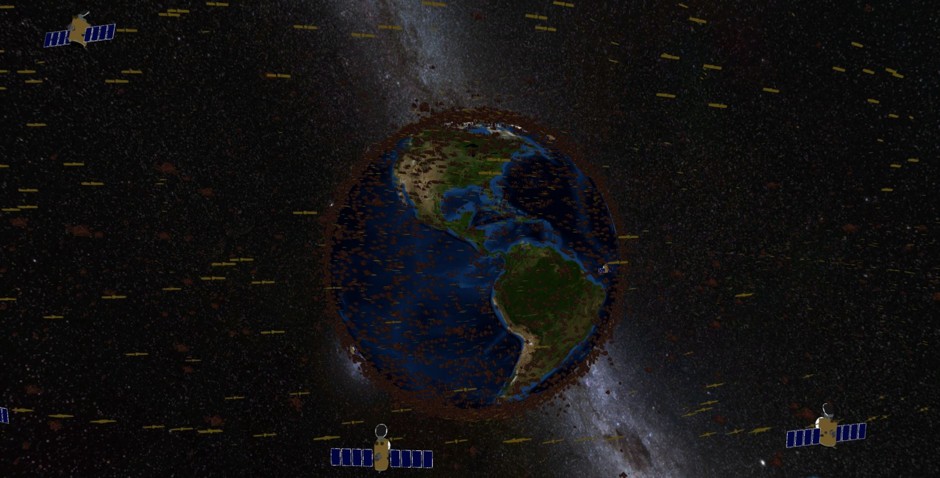
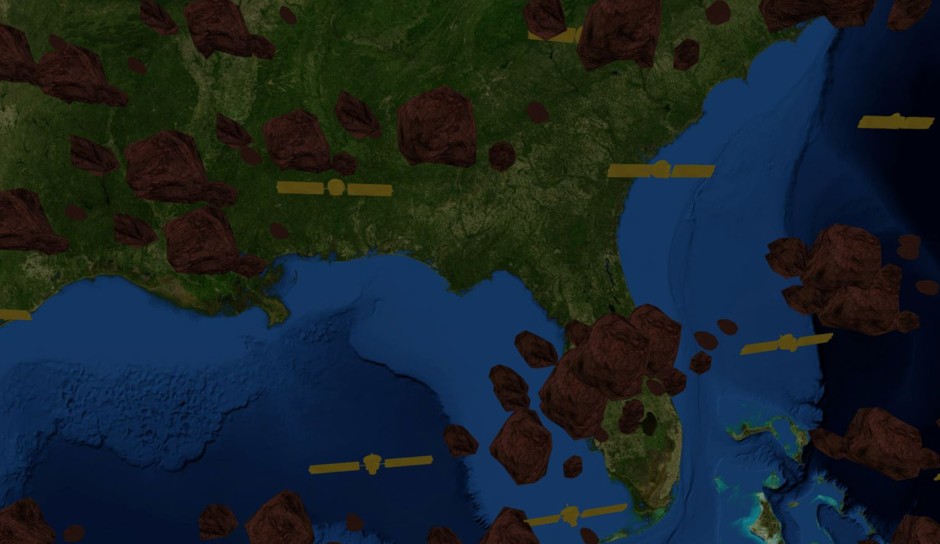
Satellites and space trash circling earth (this one’s really fun to zoom in and out of):
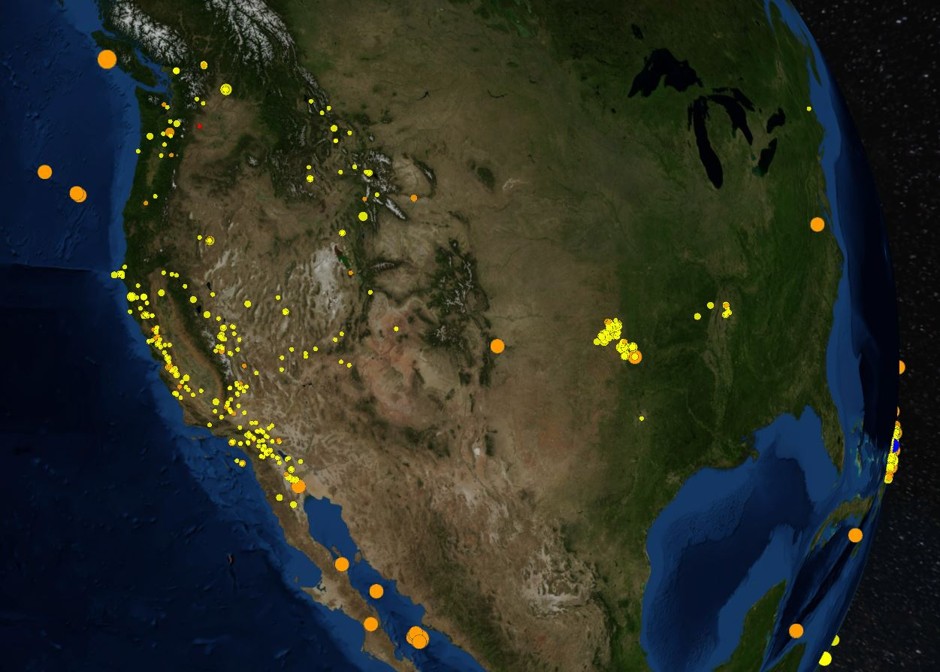
A nearly real-time map of earthquakes:
Ocean currents and temperature in 2007:
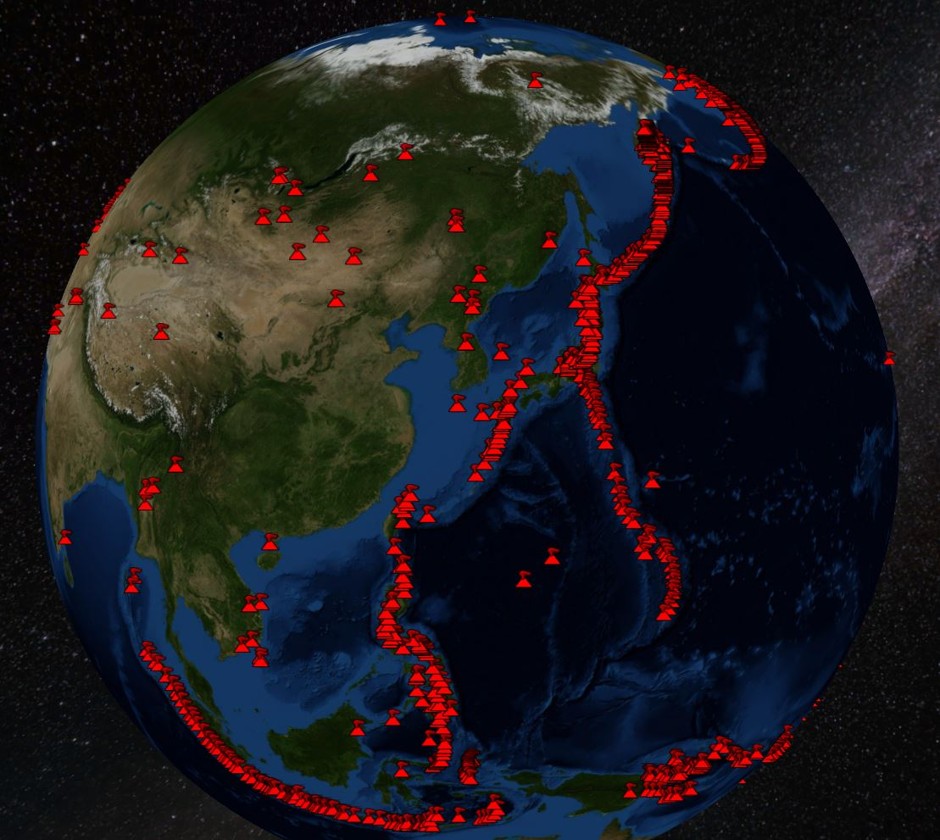
The world’s volcanoes—click one to pull up information from the Smithsonian:
Nighttime lights showing America’s cities and gas flares:

Arctic sea ice expanding and contracting over the years: